Labor Summary Reports
Generate comprehensive labor reports showing employee hours, costs, and productivity
analysis across jobs and bid items.
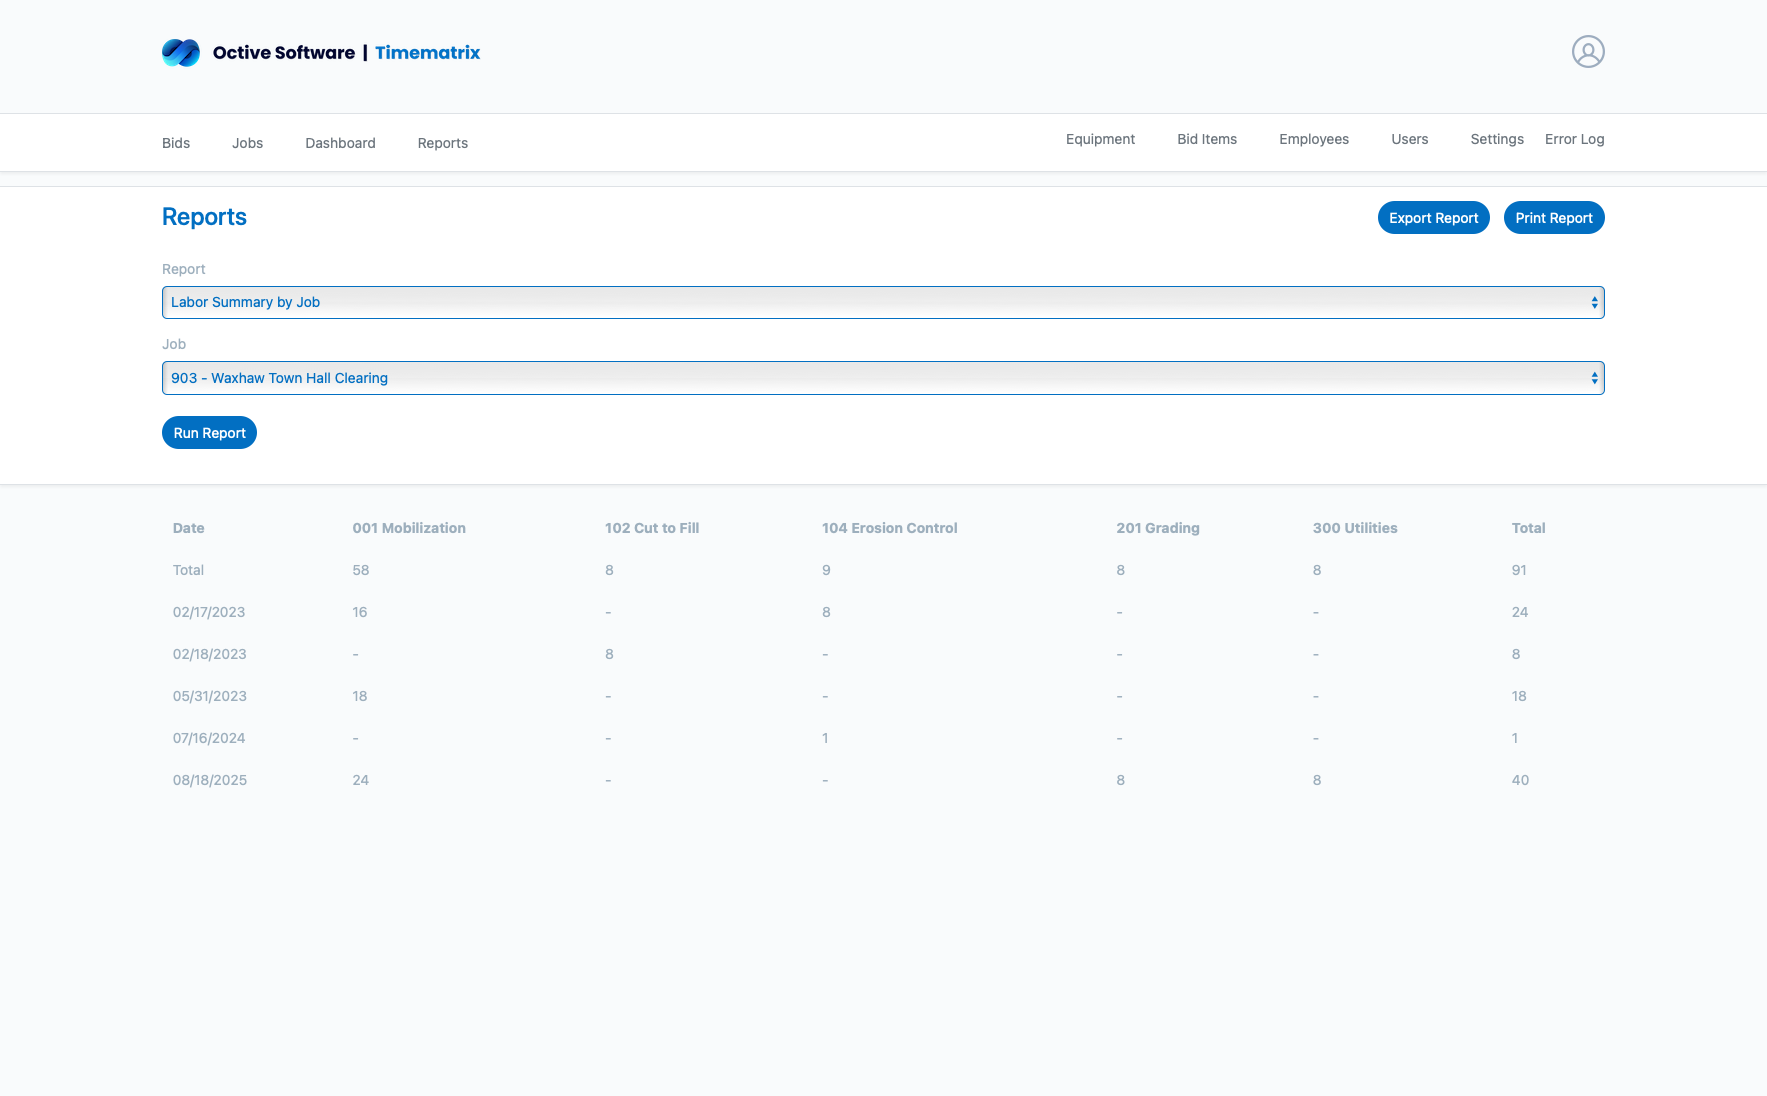
1Labor Summary by Job
Report Contents:
- Employee names and total hours worked
- Labor costs by employee and bid item
- Hour distribution across project phases
- Daily, weekly, or custom date ranges
- Summary totals and averages
Use Cases:
- Payroll verification and processing
- Project cost tracking and analysis
- Employee productivity assessment
- Budget vs. actual comparisons
- Client billing and invoicing
2Generating Labor Reports
Select Parameters
- Choose specific job or all jobs
- Set date range for analysis
- Select employees or all workers
- Filter by bid items if needed
Configure Options
- Choose report format (PDF, Excel)
- Include or exclude overtime
- Show detailed or summary view
- Add company branding
Generate & Share
- Click generate to create report
- Download or email directly
- Save report templates
- Schedule automatic generation
Pro Tip:
Set up automated weekly labor reports to be emailed to project managers every Monday morning.
Equipment Utilization & Analysis
Track equipment usage, analyze utilization rates, and identify opportunities
for optimization across your construction operations.

1Equipment Usage Reports
Utilization Metrics:
- Total productive hours by equipment
- Downtime breakdown by reason
- Utilization percentage calculations
- Cost per hour analysis
- Comparison across time periods
Performance Insights:
- Identify underutilized equipment
- Track maintenance patterns
- Optimize equipment deployment
- Plan rental vs. purchase decisions
- Improve scheduling efficiency
2Downtime Analysis
Understanding equipment downtime helps optimize operations and reduce costs.
Weather Delays
Rain, wind, extreme conditions
Mechanical Issues
Breakdowns, repairs, maintenance
Project Delays
Material shortages, scheduling
Operator Issues
Training, availability, efficiency
Important:
Regular equipment utilization analysis can identify opportunities to reduce costs by 15-20% through better deployment.
Material Usage & Cost Tracking
Monitor material consumption, track costs by bid item, and analyze
material efficiency across construction projects.
1Material Consumption Reports
Quantity Tracking:
- Materials used by bid item
- Daily consumption rates
- Cumulative usage totals
- Waste and efficiency metrics
- Supplier and source tracking
Cost Analysis:
- Material costs by project phase
- Budget vs. actual comparisons
- Unit cost trending over time
- Supplier performance analysis
- Cost optimization opportunities
2Infrastructure Progress Tracking
Track completed infrastructure installations for accurate progress monitoring.
Utility Infrastructure
- Storm drainage structures
- Sewer manholes and services
- Water line installations
- Electrical underground work
Site Improvements
- Paving and surfacing
- Curb and gutter installation
- Sidewalk construction
- Landscaping completion
Progress Metrics
- Completion percentages
- Installation rates per day
- Quality control checkpoints
- Schedule adherence tracking